Metrics
Agones controller exposes metrics via OpenCensus. OpenCensus is a single distribution of libraries that collect metrics and distributed traces from your services, we only use it for metrics but it will allow us to support multiple exporters in the future.
We choose to start with Prometheus as this is the most popular with Kubernetes but it is also compatible with Cloud Monitoring. If you need another exporter, check the list of supported exporters. It should be pretty straightforward to register a new one. (GitHub PRs are more than welcome.)
We plan to support multiple exporters in the future via environment variables and helm flags.
Backend integrations
Prometheus
If you are running a Prometheus instance you just need to ensure that metrics and kubernetes service discovery are enabled. (helm chart values agones.metrics.prometheusEnabled and agones.metrics.prometheusServiceDiscovery). This will automatically add annotations required by Prometheus to discover Agones metrics and start collecting them. (see example)
If your Prometheus metrics collection agent requires that you scrape from the pods directly(such as with Google Cloud Managed Prometheus), then the metrics ports for the controller and allocator will both be named http and exposed on 8080. In the case of the allocator, the port name and number can be overriden with the agones.allocator.serviceMetrics.http.portName and agones.allocator.serviceMetrics.http.port helm chart values.
Prometheus Operator
If you have Prometheus operator installed in your cluster, just enable ServiceMonitor installation in values:
agones:
  metrics:
    serviceMonitor:
      enabled: true
Google Cloud Managed Service for Prometheus
Google Cloud Managed Service for Prometheus is a fully managed multi-cloud solution for Prometheus. If you wish to use Managed Prometheus with Agones, follow the Google Cloud Managed Service for Prometheus installation steps.
Google Cloud Monitoring (formerly Stackdriver)
We support the OpenCensus Stackdriver exporter. In order to use it you should enable Cloud Monitoring API in Google Cloud Console. Follow the Google Cloud Monitoring installation steps to see your metrics in Cloud Monitoring.
Metrics available
| Name | Description | Type |
|---|---|---|
| agones_gameservers_count | The number of gameservers per fleet and status | gauge |
| agones_gameserver_allocations_duration_seconds | The distribution of gameserver allocation requests latencies | histogram |
| agones_gameserver_allocations_retry_total | The count of gameserver allocation retry until it succeeds | histogram |
| agones_gameserver_creation_duration | The time gameserver takes to be created in seconds | histogram |
| agones_gameservers_total | The total of gameservers per fleet and status | counter |
| agones_gameservers_allocations_total | The total of gameserver allocations | counter |
| agones_fleets_replicas_count | The number of replicas per fleet (total, desired, ready, reserved, allocated) | gauge |
| agones_fleet_counters | Aggregate Metrics for Counters within a Fleet, including total capacity and count values (Only available when Counters and Lists) are enabled) | gauge |
| agones_fleet_lists | Aggregate Metrics for Lists within a Fleet, including total capacity and List lengths (Only available when Counters and Lists) are enabled) | gauge |
| agones_fleet_autoscalers_able_to_scale | The fleet autoscaler can access the fleet to scale | gauge |
| agones_fleet_autoscalers_buffer_limits | The limits of buffer based fleet autoscalers (min, max) | gauge |
| agones_fleet_autoscalers_buffer_size | The buffer size of fleet autoscalers (count or percentage) | gauge |
| agones_fleet_autoscalers_current_replicas_count | The current replicas count as seen by autoscalers | gauge |
| agones_fleet_autoscalers_desired_replicas_count | The desired replicas count as seen by autoscalers | gauge |
| agones_fleet_autoscalers_limited | The fleet autoscaler is outside the limits set by MinReplicas and MaxReplicas. | gauge |
| agones_gameservers_node_count | The distribution of gameservers per node | histogram |
| agones_nodes_count | The count of nodes empty and with gameservers | gauge |
| agones_gameserver_state_duration | The distribution of gameserver state duration in seconds. Note: this metric could have some missing samples by design. Do not use the _total counter as the real value for state changes. |
histogram |
| agones_k8s_client_http_request_total | The total of HTTP requests to the Kubernetes API by status code | counter |
| agones_k8s_client_http_request_duration_seconds | The distribution of HTTP requests latencies to the Kubernetes API by status code | histogram |
| agones_k8s_client_workqueue_depth | Current depth of the work queue | gauge |
| agones_k8s_client_workqueue_latency_seconds | How long an item stays in the work queue | histogram |
| agones_k8s_client_workqueue_items_total | Total number of items added to the work queue | counter |
| agones_k8s_client_workqueue_work_duration_seconds | How long processing an item from the work queue takes | histogram |
| agones_k8s_client_workqueue_retries_total | Total number of items retried to the work queue | counter |
| agones_k8s_client_workqueue_longest_running_processor | How long the longest running workqueue processor has been running in microseconds | gauge |
| agones_k8s_client_workqueue_unfinished_work_seconds | How long unfinished work has been sitting in the workqueue in seconds | gauge |
Dropping Metric Labels
When a Fleet or FleetAutoscaler is deleted from the system, Agones will automatically clear metrics that utilise their name as a label from the exported metrics, so the metrics exported do not continuously grow in size over the lifecycle of the Agones installation.
Dashboard
Grafana Dashboards
We provide a set of useful Grafana dashboards to monitor Agones workload, they are located under the grafana folder :
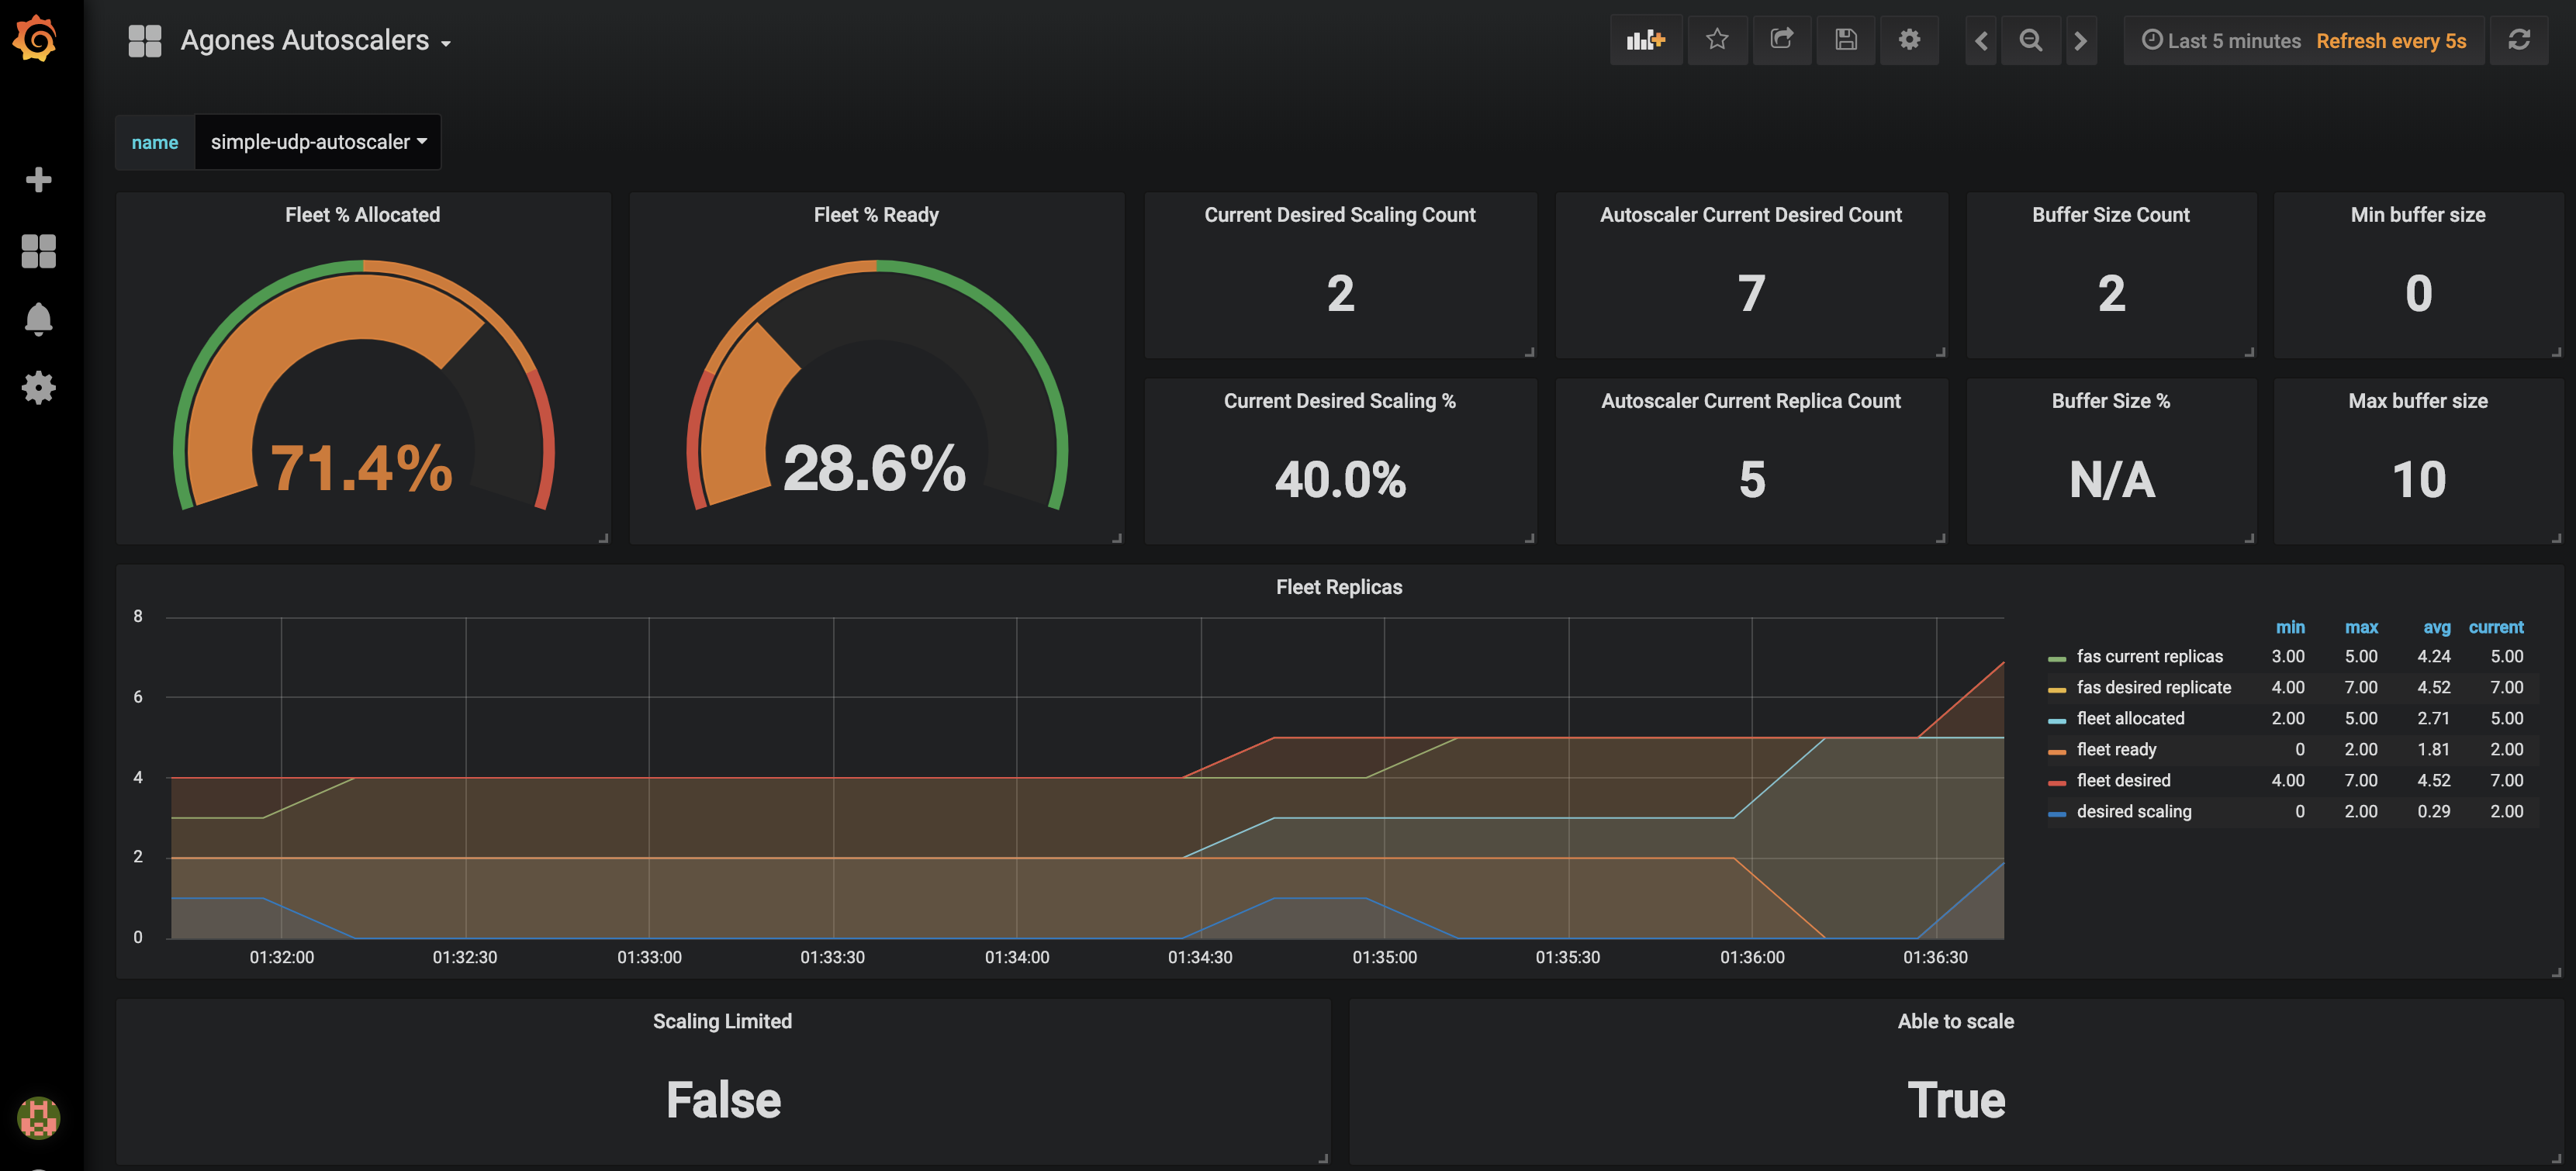
-
Agones Autoscalers allows you to monitor your current autoscalers replicas request as well as fleet replicas allocation and readyness statuses. You can only select one autoscaler at the time using the provided dropdown.
-
Agones GameServers displays your current game servers workload status (allocations, game servers statuses, fleets replicas) with optional fleet name filtering.
-
Agones GameServer Allocations displays Agones gameservers allocations rates and counts per fleet.
-
Agones Allocator Resource displays Agones Allocators CPU, memory usage and also some useful Golang runtime metrics.
-
Agones Status displays Agones controller health status.
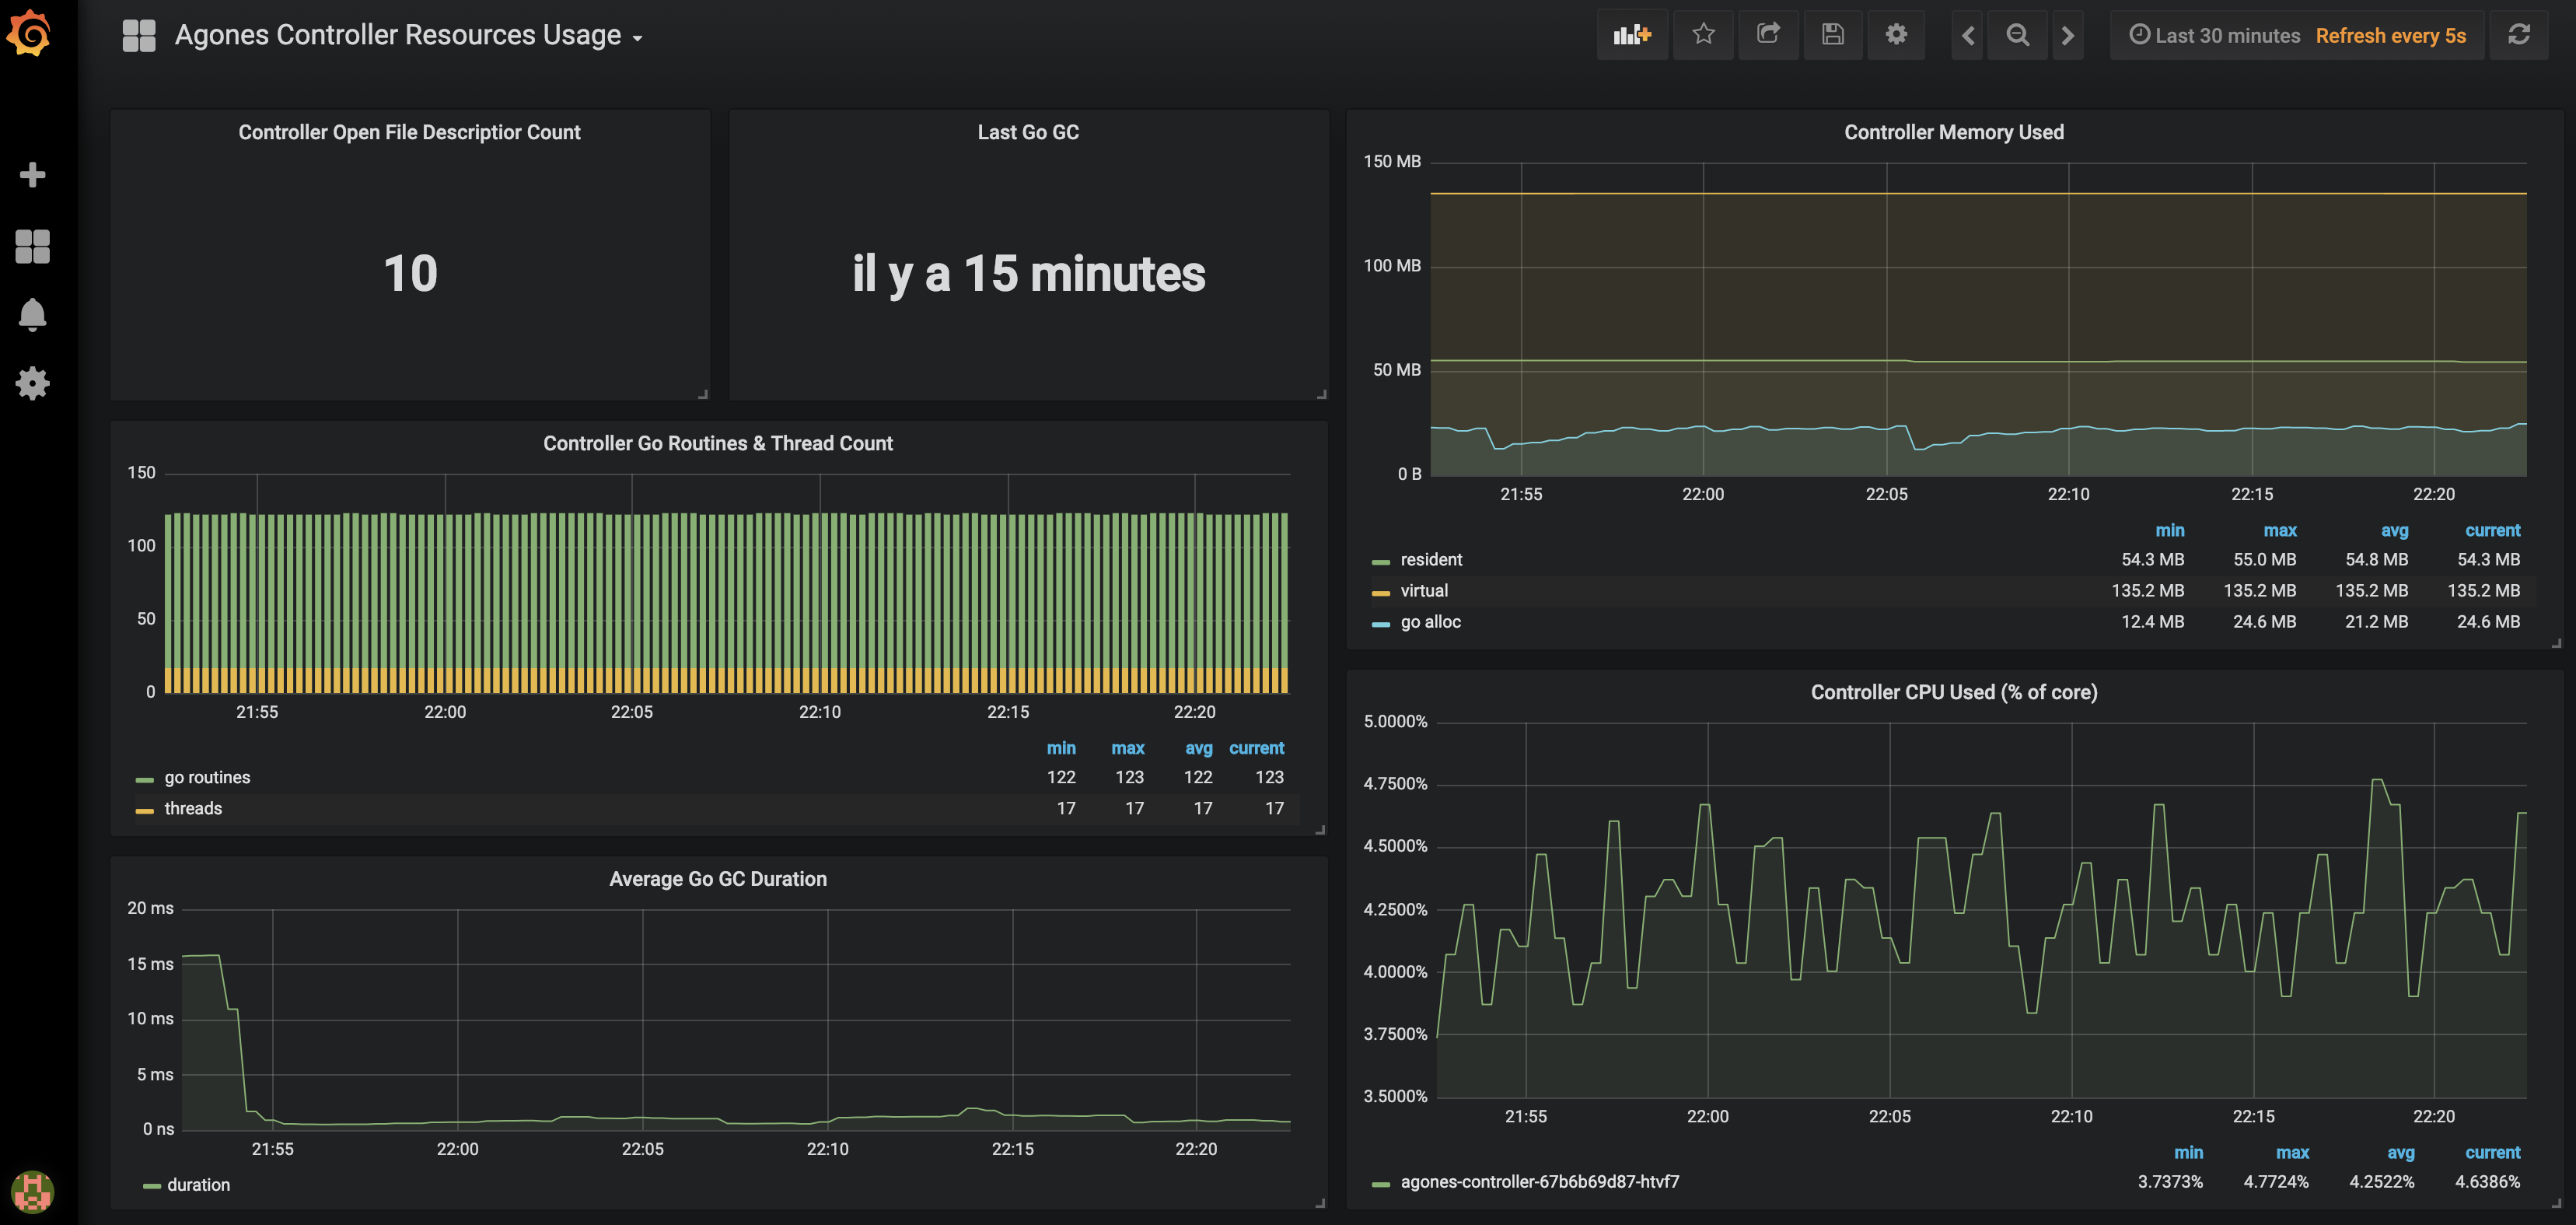
-
Agones Controller Resource Usage displays Agones Controller CPU and memory usage and also some Golang runtime metrics.
-
Agones Controller go-client requests displays Agones Controller Kubernetes API consumption.
-
Agones Controller go-client workqueues displays Agones Controller workqueue processing time and rates.
-
Agones Controller API Server requests displays your current API server request rate, errors rate and request latencies with optional CustomResourceDefinition filtering by Types: fleets, gameserversets, gameservers, gameserverallocations.
Dashboard screenshots :
You can import our dashboards by copying the json content from each config map into your own instance of Grafana (+ > Create > Import > Or paste json) or follow the installation guide.
Installation
When operating a live multiplayer game you will need to observe performances, resource usage and availability to learn more about your system. This guide will explain how you can setup Prometheus and Grafana into your own Kubernetes cluster to monitor your Agones workload.
Before attemping this guide you should make sure you have kubectl and helm installed and configured to reach your kubernetes cluster.
Prometheus installation
Prometheus is an open source monitoring solution, we will use it to store Agones controller metrics and query back the data.
Let’s install Prometheus using the Prometheus Community Kubernetes Helm Charts repository.
helm repo add prometheus-community https://prometheus-community.github.io/helm-charts
helm repo update

helm upgrade --install --wait prom prometheus-community/prometheus --namespace metrics --create-namespace \
    --version 28.9.0 \
    --set server.global.scrape_interval=30s \
    --set server.persistentVolume.enabled=true \
    --set server.persistentVolume.size=64Gi \
    -f ./build/prometheus.yaml
For resiliency it is recommended to run Prometheus on a dedicated node which is separate from nodes where Game Servers
are scheduled. If you use the above command, with our
prometheus.yaml
to set up Prometheus, it will schedule Prometheus pods on nodes
tainted with agones.dev/agones-metrics=true:NoExecute and labeled with agones.dev/agones-metrics=true if available.
As an example, to set up a dedicated node pool for Prometheus on GKE, run the following command before installing Prometheus. Alternatively you can taint and label nodes manually.
gcloud container node-pools create agones-metrics --cluster=... --zone=... \
  --node-taints agones.dev/agones-metrics=true:NoExecute \
  --node-labels agones.dev/agones-metrics=true \
  --num-nodes=1 \
  --machine-type=e2-standard-4
By default we will disable the push gateway (we don’t need it for Agones) and other exporters.
The helm chart supports nodeSelector, affinity and toleration, you can use them to schedule Prometheus deployments on an isolated node(s) to have an homogeneous game servers workload.
This will install a Prometheus Server in your current cluster with Persistent Volume Claim (Deactivated for Minikube and Kind) for storing and querying time series, it will automatically start collecting metrics from Agones Controller.
Finally, to access Prometheus metrics, rules and alerts explorer use
kubectl port-forward deployments/prom-prometheus-server 9090 -n metrics
Now you can access the prometheus dashboard http://localhost:9090.
On the landing page you can start exploring metrics by creating queries. You can also verify what targets Prometheus currently monitors (Header Status > Targets), you should see Agones controller pod in the kubernetes-pods-agones section.
Metrics will be first registered when you will start using Agones.
Now let’s install some Grafana dashboards.
Grafana installation
Grafana is a open source time series analytics platform which supports Prometheus data source. We can also easily import pre-built dashboards.
First we will install Agones dashboard as config maps in our cluster.
kubectl apply -f ./build/grafana/
Now we can install the
Grafana Community Kubernetes Helm Charts from their repository. (Replace <your-admin-password> with the admin password of your choice)
helm repo add grafana-community https://grafana-community.github.io/helm-charts
helm repo update

helm upgrade --install --wait grafana grafana-community/grafana --namespace metrics \
  --set adminPassword=<your-admin-password> -f ./build/grafana.yaml
This will install Grafana with our prepopulated dashboards and prometheus datasource previously installed
Finally to access dashboards run
kubectl port-forward deployments/grafana 3000 -n metrics
Open a web browser to http://localhost:3000, you should see Agones dashboards after login as admin.
Google Cloud Managed Service for Prometheus installation
To collect Agones metrics using Managed Prometheus:
-
Follow the instructions to enable managed collection for a GKE cluster or non-GKE cluster.
-
Configure Managed Prometheus to scrape Agones by creating a
PodMonitoringresource:
kubectl apply -n agones-system -f https://raw.githubusercontent.com/googleforgames/agones/release-1.59.0/build/prometheus-google-managed.yaml
- Confirm that you can see Prometheus metrics in Cloud Monitoring. If that’s all you need, you can stop here.
To install Grafana using a Managed Prometheus backend:
- Complete the Before you begin. To align with the Agones Grafana installation, we’ll be installing in the
metricsnamespace, which you’ll need to create.- If your cluster has Workload Identity enabled, which is enabled on GKE Autopilot by default, follow Configure a service account for Workload Identity to ensure that you have appropriately authorized the default Kubernetes service account in the
metricsnamespace.
- If your cluster has Workload Identity enabled, which is enabled on GKE Autopilot by default, follow Configure a service account for Workload Identity to ensure that you have appropriately authorized the default Kubernetes service account in the
- Install the Standalone Prometheus frontend UI in the
metricsnamespace - this will act as your authentication proxy for PromQL queries. - Install Grafana as above, using
-f ./build/grafana-frontend.yamlinstead of-f ./build/grafana.yaml.
Google Cloud Monitoring installation
In order to use Google Cloud Monitoring you must enable the Monitoring API in the Google Cloud Console. The Cloud Monitoring exporter uses a strategy called Application Default Credentials (ADC) to find your application’s credentials. Details can be found in Setting Up Authentication for Server to Server Production Applications.
You need to grant all the necessary permissions to the users (see Access Control Guide). The predefined role Monitoring Metric Writer contains those permissions. Use the following command to assign the role to your default service account.
gcloud projects add-iam-policy-binding [PROJECT_ID] --member serviceAccount:[PROJECT_NUMBER]-compute@developer.gserviceaccount.com --role roles/monitoring.metricWriter
Cloud Operations for GKE (including Cloud Monitoring) is enabled by default on GKE clusters, however you can follow this guide if it is currently disabled in your GKE cluster.
Before proceeding, ensure you have created a metrics node pool as mentioned in the Google Cloud installation guide.
The default metrics exporter installed with Agones is Prometheus. If you are using the Helm installation, you can install or upgrade Agones to use Cloud Monitoring, using the following chart parameters:
helm upgrade --install --wait --set agones.metrics.stackdriverEnabled=true --set agones.metrics.prometheusEnabled=false --set agones.metrics.prometheusServiceDiscovery=false my-release-name agones/agones --namespace=agones-system
If you are using the YAML installation, follow the instructions on the page to change the above parameters by using helm to generate a custom YAML file locally.
With this configuration only the Cloud Monitoring exporter would be used instead of Prometheus exporter.
Using Cloud Monitoring with Workload Identity
If you would like to enable Cloud Monitoring in conjunction with Workload Identity, there are a few extra steps you need to follow:
-
When setting up the Google service account following the instructions for Authenticating to Google Cloud, create two IAM policy bindings, one for
serviceAccount:PROJECT_ID.svc.id.goog[agones-system/agones-controller]and one forserviceAccount:PROJECT_ID.svc.id.goog[agones-system/agones-allocator]. -
Pass parameters to helm when installing Agones to add annotations to the
agones-controllerandagones-allocatorKubernetes service accounts:
helm install my-release --namespace agones-system --create-namespace agones/agones --set agones.metrics.stackdriverEnabled=true --set agones.metrics.prometheusEnabled=false --set agones.metrics.prometheusServiceDiscovery=false --set agones.serviceaccount.allocator.annotations."iam\.gke\.io/gcp-service-account"="GSA_NAME@PROJECT_ID\.iam\.gserviceaccount\.com" --set agones.serviceaccount.allocator.labels."iam\.gke\.io/gcp-service-account"="GSA_NAME@PROJECT_ID\.iam\.gserviceaccount\.com" --set agones.serviceaccount.controller.annotations."iam\.gke\.io/gcp-service-account"="GSA_NAME@PROJECT_ID\.iam\.gserviceaccount\.com"
To verify that metrics are being sent to Cloud Monitoring, create a Fleet or a Gameserver and look for the metrics to show up in the Cloud Monitoring dashboard. Navigate to the Metrics explorer and search for metrics with the prefix agones/. Select a metric and look for data to be plotted in the graph to the right.
An example of a custom dashboard is:
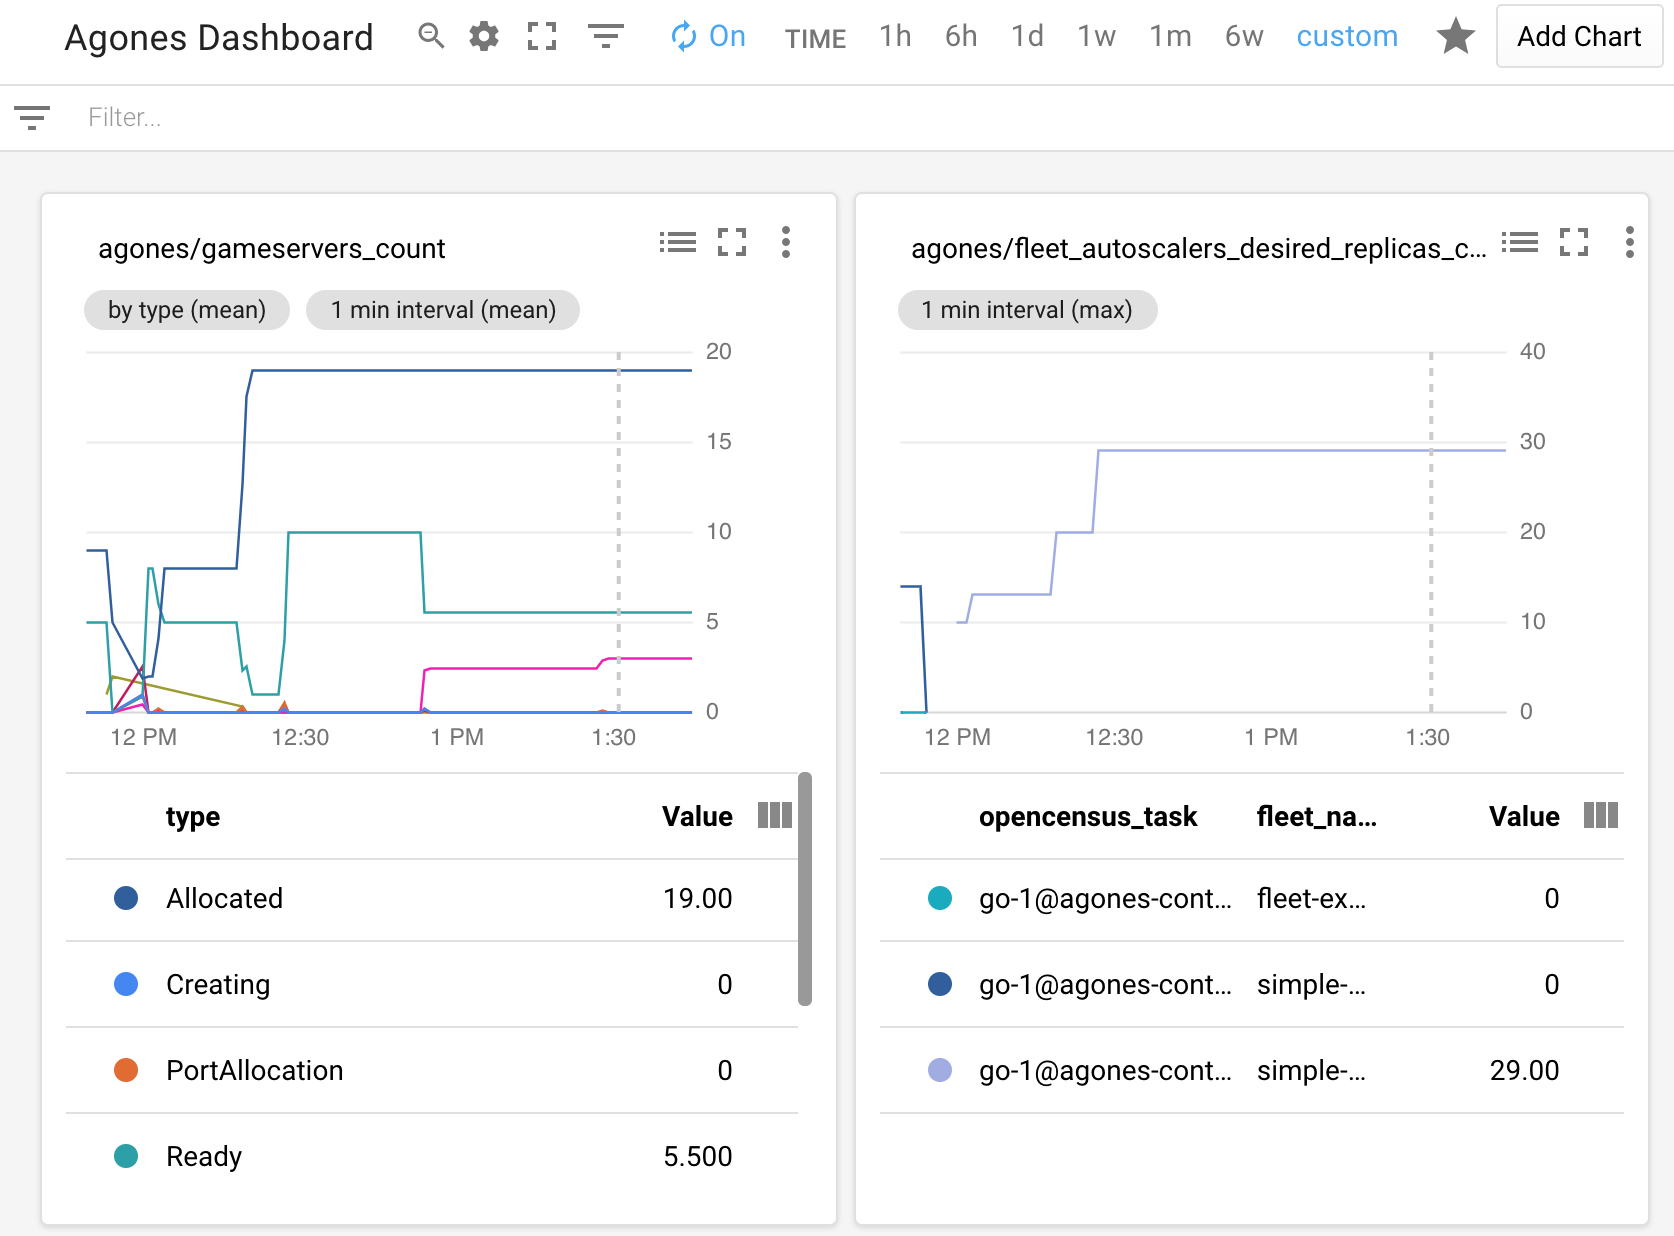
Currently there exists only manual way of configuring Cloud Monitoring Dashboard. So it is up to you to set an Alignment Period (minimal is 1 minute), GroupBy, Filter parameters and other graph settings.
Troubleshooting
If you can’t see Agones metrics you should have a look at the controller logs for connection errors. Also ensure that your cluster has the necessary credentials to interact with Cloud Monitoring. You can configure stackdriverProjectID manually, if the automatic discovery is not working.
Permissions problem example from controller logs:
Failed to export to Stackdriver: rpc error: code = PermissionDenied desc = Permission monitoring.metricDescriptors.create denied (or the resource may not exist).
If you receive this error, ensure your service account has the role or corresponding permissions mentioned above.
Feedback
Was this page helpful?
Glad to hear it! Please tell us how we can improve.
Sorry to hear that. Please tell us how we can improve.
Last modified July 25, 2026: chore: promote PortPolicyNone feature gate from beta to stable (#4627) (d85fef9)